
About Grafana
Grafana Labs is the company behind Grafana, the open source platform for dashboards and observability. The Grafana stack brings metrics, logs, traces, profiles, dashboards, and alerting together in one place, with a free Grafana Cloud tier that includes everything you need for this hackathon. Grafana gives your agent two things for this challenge:
- The Grafana Cloud MCP server — 60+ tools your Gemini agent can call to query metrics, logs, and traces, search dashboards, and manage alerts and incidents. This is how your agent gets live production context and acts on it.
- AI Observability — OpenTelemetry-native monitoring for the agent itself. Pre-built dashboards track your agent's LLM calls, token cost, latency, and MCP tool activity, so you can debug your agent while you build it and show its behavior in your demo.
- Build an agent that uses observability data — and observe the agent you build. Learn more at grafana.com.
Grafana: your project must actively use the Grafana stack at runtime, primarily through the Grafana Cloud MCP server (the official grafana/mcp-grafana server, or the hosted Grafana Cloud MCP endpoint), which exposes 60+ tools for querying metrics, logs, and traces, searching dashboards, and managing alerts and incidents. Grafana Cloud AI Observability (OpenTelemetry-native monitoring of your agent's LLM calls, token cost, latency, and MCP tool activity) is a good complement but doesn't satisfy this requirement on its own — the MCP server connection is what's checked.
What participants can build with Grafana MCP
Use Grafana MCP to let your agent:
- Query metrics (PromQL-compatible) and logs (LogQL) for live system context. - Search dashboards and generate links back to Grafana for human review. - Investigate incidents and alerts using Grafana IRM-related workflows. - Correlate metrics, logs, and traces during root-cause analysis.
- Execute these actions through MCP instead of custom point integrations.
How to Get Started
- Create a free Grafana Cloud account. Sign up at https://grafana.com/products/cloud/ — the free tier includes metrics, logs, traces, dashboards, and alerting. Details: https://grafana.com/docs/grafana-cloud/get-started/create-account/
- Accept the Grafana Assistant terms. A stack administrator must accept the Grafana Assistant terms and conditions once before the MCP server can be used. If you created the account, you are the administrator. Access also requires the Editor role or higher (the account creator has this by default).
- (Optional) Explore the tools from your desktop. Point any MCP client (Gemini CLI, Cursor, Claude Desktop) at the hosted Grafana Cloud MCP server to browse the 60+ available tools before writing agent code:
- Endpoint: https://mcp.grafana.com/mcp (Streamable HTTP; SSE is not supported)
- Header (recommended): X-Grafana-URL: https://<your-stack>.grafana.net
- Auth: OAuth 2.1 — your browser opens once to authorize. Docs: https://grafana.com/docs/grafana-cloud/machine-learning/assistant/configure/cloud-mcp/
- Connect your agent with the Agent Development Kit (ADK). ADK (Python and TypeScript) has built-in support for the Grafana Cloud MCP server:
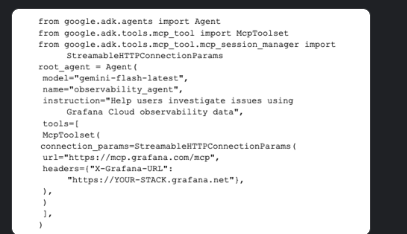
- The first time your agent connects, your browser opens to authorize the connection. The token is valid for 1 hour and refreshes automatically for 30 days, so you authorize once and build. Full guide and tool reference here.
- Build, iterate, and submit. Give your agent a real multi-step mission — investigate a firing alert, correlate Loki logs with Tempo traces, summarize root cause, annotate a dashboard. Submit with a public repo (open-source license required) and a ~3-minute demo video.
-
- Note on unattended deployments: the hosted Grafana Cloud MCP server authenticates users interactively — there is no service-account or machine-token option. Run your agent where you can complete the one-time browser authorization (your development machine is fine for building and recording your demo). If your project requires a fully unattended server-side agent, use the open-source Grafana MCP server with a service-account token instead: https://grafana.com/docs/grafana/latest/developer-resources/mcp/
Observe your agent with Grafana AI Observability
You can also monitor the agent you build (including MCP interactions) using Grafana Cloud AI Observability (currently in public preview). Capabilities include:
- Agent traces, conversations, token usage, and cost tracking.
- Automated quality evaluations of agent outputs.
- MCP protocol and tool-call observability.
- Docs and walkthrough:
Note: recommended but not required. Instrumentation uses the AI Observability SDK for your language; standard free-tier usage and retention limits apply.
Resources
Core Grafana MCP Docs:
Query and Telemetry References:
- Loki / LogQL
- Mimir
- Tempo
- Cloud Traces MCP endpoint blog
Google Integration References: